AI agents on our platform handled 181,555 connected calls between October 2025 and September 2026. Of the calls made to business lines, 37.6% arrived outside Monday to Friday, 8am to 6pm, in the caller's local time, and the busiest single hour was 7 to 8am. Half of those calls ended within 26 seconds. More than half of all inbound calls were people calling back a number that had dialed them.
| Statistic | Figure | What it covers |
|---|---|---|
| Connected calls | 181,555 | October 2025 to September 2026, internal and test calls excluded |
| Outbound share | 98.6% (179,020 calls) | Dials that a person, a voicemail box or a phone system answered |
| Inbound calls | 2,535 | Every call an agent answered |
| Inbound calls that were callbacks | 55.7% (1,412 calls) | People returning a call from a number that had dialed them |
| Calls to business lines outside weekday 8am to 6pm | 37.6% | 1,123 inbound calls, callbacks excluded |
| Calls to business lines on a weekend | 11.0% | Saturday and Sunday |
| Busiest hour | 7 to 8am, 113 calls | Caller's local time |
| Median call to a business line | 26 seconds | Answer to hangup |
| Median connected outbound call | 35 seconds | Answer to hangup |
| Connected outbound calls that reached voicemail | 48.7% | March to September 2026 |
| US customer service representatives | 2,595,750 | Bureau of Labor Statistics, May 2025, all industries |
How many calls are in this data, and which way did they go?
The data covers 181,555 connected calls over 12 months: 179,020 outbound (98.6%) and 2,535 inbound (1.4%). A call counts when the agent was connected to the other end. We left out 12,622 outbound dials nobody answered and 1,047 internal and test calls, so the total sits below the running count on our homepage.
The split tells you more about who runs programs with us than about call centers in general. Most of the outbound volume comes from large outbound calling programs, so 98.6% is not a guide to how much of a typical center's work is outbound. Calls to our customers' business lines are the part most worth comparing with your own, and they get most of the attention below.
What share of calls come in after hours?
Of the 1,123 calls made to business lines, 37.6% arrived outside Monday to Friday, 8am to 6pm, in the caller's local time: 26.5% on weekdays before 8am or after 6pm, and 11.0% on Saturday or Sunday. Counting every day of the week alike, 29.3% came in before 8am or after 6pm.
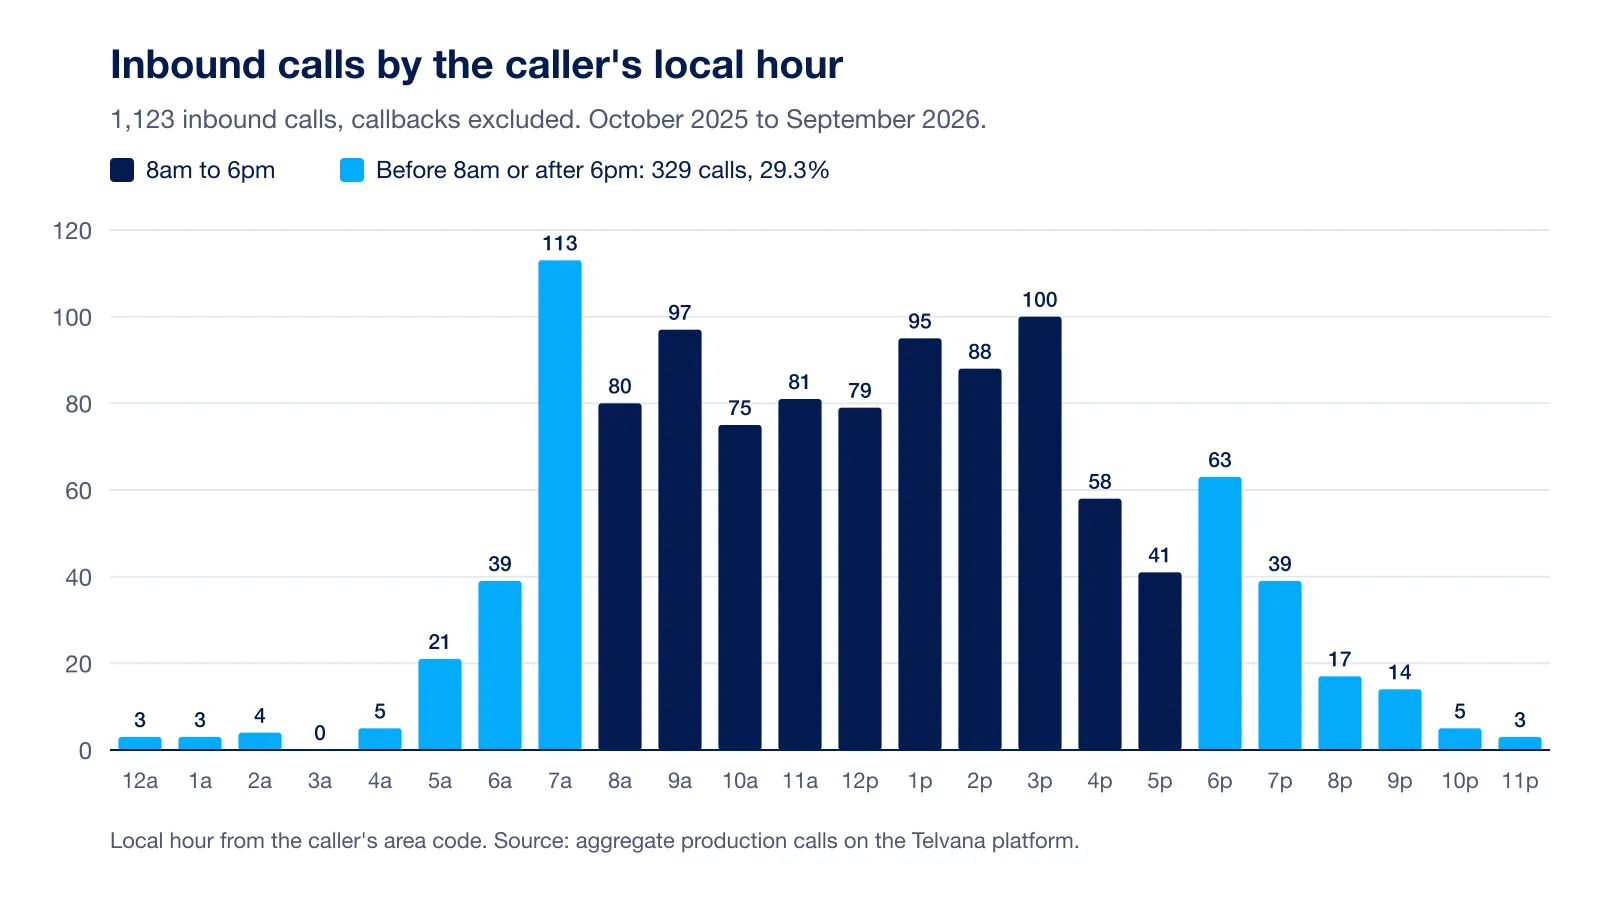
| Caller's local time | Calls | Share |
|---|---|---|
| Midnight to 5am | 15 | 1.3% |
| 5 to 8am | 173 | 15.4% |
| 8am to noon | 333 | 29.7% |
| Noon to 4pm | 362 | 32.2% |
| 4 to 6pm | 99 | 8.8% |
| 6 to 9pm | 119 | 10.6% |
| 9pm to midnight | 22 | 2.0% |
The hour from 7 to 8am took 113 calls, more than any hour of the working day. Calls also picked up again after 6pm: the 6pm hour took 63, more than 4pm (58) or 5pm (41). With the largest customer's calls taken out, 32.5% still arrived outside weekday business hours, so the pattern doesn't come from one account.
Local time comes from the caller's area code. A mobile number kept after a move to another state can put a call in the wrong hour, and the 3% of calls from toll-free or unknown area codes were read as Pacific time.
Which days get the most calls?
Wednesday took the most calls to business lines, 25.9% of the week, and the weekend took the fewest, 5.6% on Saturday and 5.4% on Sunday. Thursday and Friday each came in under 13%. With callbacks counted in, Tuesday and Wednesday ran almost level.
| Day | Calls to business lines | All inbound calls | Connected outbound calls |
|---|---|---|---|
| Monday | 17.5% | 18.1% | 19.3% |
| Tuesday | 19.9% | 22.9% | 21.9% |
| Wednesday | 25.9% | 22.6% | 15.2% |
| Thursday | 12.8% | 15.4% | 13.8% |
| Friday | 12.9% | 12.7% | 13.2% |
| Saturday | 5.6% | 4.3% | 7.7% |
| Sunday | 5.4% | 4.1% | 9.0% |
The outbound column shows when our customers schedule their campaigns. It says nothing about when people like to be called, so don't plan a dialing window from it. Outbound days are in the called party's local time.
How long does a call center call last?
On these lines, half the calls to a business line were over within 26 seconds of the answer and 71.9% within a minute, while the longest tenth ran past 178 seconds. Connected outbound calls had a median of 35 seconds, and nine in ten were over by 73 seconds.
| Calls | Median | 90th percentile | Under 60 seconds |
|---|---|---|---|
| Calls to business lines (callbacks excluded) | 26 seconds | 178 seconds | 71.9% |
| Callbacks | 8 seconds | Not calculated | 91.4% |
| All inbound calls | 11 seconds | 110 seconds | 82.8% |
| Connected outbound calls | 35 seconds | 73 seconds | 79.9% |
| Connected outbound, voicemail left out (March to September 2026) | 35 seconds | 85 seconds | 76.8% |
Each duration runs from the moment the call's audio connects to the agent until hangup: from the agent's answer on an inbound call, and from the moment the far end picks up on an outbound one. Ring time isn't in it. On the 72,854 calls where the phone carrier's own duration is stored too, the two agree to within about a second at the median.
These are talk times. A human agent's average handle time adds hold and after-call work on top of the conversation, so set these numbers beside talk time, not beside your AHT (average handle time breaks those parts out).
About half of connected outbound calls reached a voicemail box: 48.7% from March to September 2026, the months in which voicemail was tagged consistently from the call transcript. Leaving voicemail out for those months, the median stays at 35 seconds and the 90th percentile moves to 85 seconds.
How many inbound calls are callbacks?
More than half of inbound calls, 1,412 of 2,535 or 55.7%, came from people calling back a number one of our agents had dialed them from, mostly within seven days of that call. These callbacks were short, with a median of 8 seconds and 91.4% over within a minute, and most came in during the day.
Callbacks outnumbered calls to the business lines themselves, 1,412 to 1,123. If you run an outbound program, the numbers you dial from get called back, so decide before the first dial what answers those calls and what a caller who rings back hears. A confirmation call script needs a callback version as much as a voicemail one.
They are also why the rest of this page sets callbacks aside. Counted in, they pull the median inbound call down from 26 to 11 seconds and the share outside weekday business hours down from 37.6% to 25.3%, because they cluster in the daytime.
What do these call statistics mean for staffing and coverage?
Your own pattern will differ, but two findings here are worth checking against it first. The busiest hour was 7 to 8am, so look at the hour before you open. A little over a third of calls to business lines came outside weekday business hours, which is the share to hold your night and weekend coverage up against.
A midweek peak with a light Thursday and Friday, as here, means the same headcount on every weekday leaves some days short and others with idle time. The roster math for that is in the workforce management guide, and the service level guide shows what one interval short of staff does to the day's number. To see how many agents your busiest half hour needs, put your volume and handle time into the staffing calculator. For which numbers to put in front of the team each week, start with call center metrics and KPIs.
Run the same cut on your own call records
If your phone system exports call detail records with a start time, a direction, a duration and the other party's number, you can repeat everything above.
- Export 90 days of call records, or 12 months if you have them.
- Remove internal and test numbers, calls with zero duration and outbound dials nobody answered.
- Mark as a callback any inbound call from a number you dialed in the previous seven days.
- Convert each start time to the caller's local time, from the area code, or to your site's time if most callers are local.
- Work out the figures in the table below for calls to your business lines, callbacks left out.
| Statistic | Our figure | Your figure |
|---|---|---|
| Share outside weekday 8am to 6pm | 37.6% | |
| Share on Saturday and Sunday | 11.0% | |
| Busiest hour | 7 to 8am | |
| Busiest day | Wednesday | |
| Median talk time | 26 seconds | |
| 90th percentile talk time | 178 seconds | |
| Callbacks as a share of inbound | 55.7% |
If a large share of your calls lands outside your open hours, the after-hours and overflow setup shows how an AI agent can take them.
How many customer service representatives work in the US?
The Bureau of Labor Statistics counted 2,595,750 customer service representatives in May 2025, at a median wage of $44,770 a year, or $21.53 an hour. It counted 58,430 telemarketers, at a median of $35,450 a year, or $17.04 an hour. Both counts cover every industry, since representatives also work in retail, insurance, banking and elsewhere, so neither is a headcount of call centers.
| Occupation (BLS, May 2025) | US employment | Median annual wage | Median hourly wage |
|---|---|---|---|
| Customer service representatives | 2,595,750 | $44,770 | $21.53 |
| Telemarketers | 58,430 | $35,450 | $17.04 |
How we counted these calls
The figures are aggregate Telvana production calls, October 2025 to September 2026, in Pacific calendar months, across all of our production customers. None of them identifies a customer, a client program or a caller, and our engineering team checked each one against production records before we published it.
- A call is a production call record with a duration above zero, meaning the agent was connected to the other end. Inbound covers every call an agent answered; outbound covers dials that a person, a voicemail box or a phone system answered.
- We started from 195,227 records and removed 1,047 internal and test calls, our own demo line included, 12,622 outbound dials nobody answered and 3 inbound calls with no duration, which leaves 181,555.
- Unanswered dials were only recorded from April 2026, so counting them would have distorted any comparison across the year.
- Our homepage counter counts every call record since July 2025, internal calls and unanswered dials included, which is why it runs higher.
These figures describe one platform's customer mix. Compare them with your own data rather than treating them as an industry benchmark.
The platform behind these calls
Every call on this page was answered or placed by an AI agent on Telvana. Contact centers and BPOs use those agents to answer a dedicated line, a phone-menu option or the overflow and after-hours calls a team can't reach, and to run outbound call campaigns from a list within the hours they set. A call that needs a person transfers to the number you choose, under rules you set. Every call is recorded, transcribed, summarized and tagged by outcome, and BPOs give each client program its own workspace. Our team builds each agent from your scripts and tests it with you before it takes a live call. Pricing starts at $399 a month based on call volume, plus a one-time setup fee (pricing).
Frequently asked questions
How many calls does a call center get a day?
It depends on staffing and handle time more than on any typical figure. One agent on the phones for eight hours at 80% occupancy with a six-minute handle time takes about 64 calls a day (480 minutes × 0.8 ÷ 6). Multiply by agents on the phones for a center's capacity, and see call center occupancy for why 80% isn't a given.
What percentage of calls come in after hours?
In our data, 37.6% of calls to business lines arrived outside Monday to Friday, 8am to 6pm, and 11.0% on weekends, with callbacks excluded. Your share depends on your hours and your callers, so pull it from your own call records with the steps above.
How long is the average call center call?
For calls handled by AI agents on our platform, the median call to a business line lasted 26 seconds from answer to hangup, and the median connected outbound call 35 seconds. A human agent's average handle time is longer because it includes hold and after-call work, so compare like with like.
What are the most important call center statistics to track?
Our call center metrics guide starts with five: the share of callers who waited at all, service level against calls offered, abandonment rate with the average time before abandoning, cost per resolved contact, and repeat contact rate in a fixed window. It gives the formula for each and the ways each one misleads.
How many customer service representatives are there in the US?
The Bureau of Labor Statistics counted 2,595,750 customer service representatives and 58,430 telemarketers in May 2025. Both figures cover every industry, not only call centers.
See your own call pattern on a demo
Book a demo and bring your opening hours and your top call types. You'll hear an AI agent handle one of those calls, and we can talk through which hours to cover first.